
Keyword ranking reports are dead!
Well, at least as a KPI for SEO performance.
Sure, I know that isn’t like declaring that SEO is dead (I doubt it ever will be), but simply using ranking reports to measure your SEO performance is a thing of the past.
I realize this isn’t a popular position among my fellow SEOs. But the truth about ranking reports is that they’re now a trending tool.
I’m not saying that they aren’t still important I’m simply saying that rank isn’t the most important KPI when it comes to measuring SEO performance.
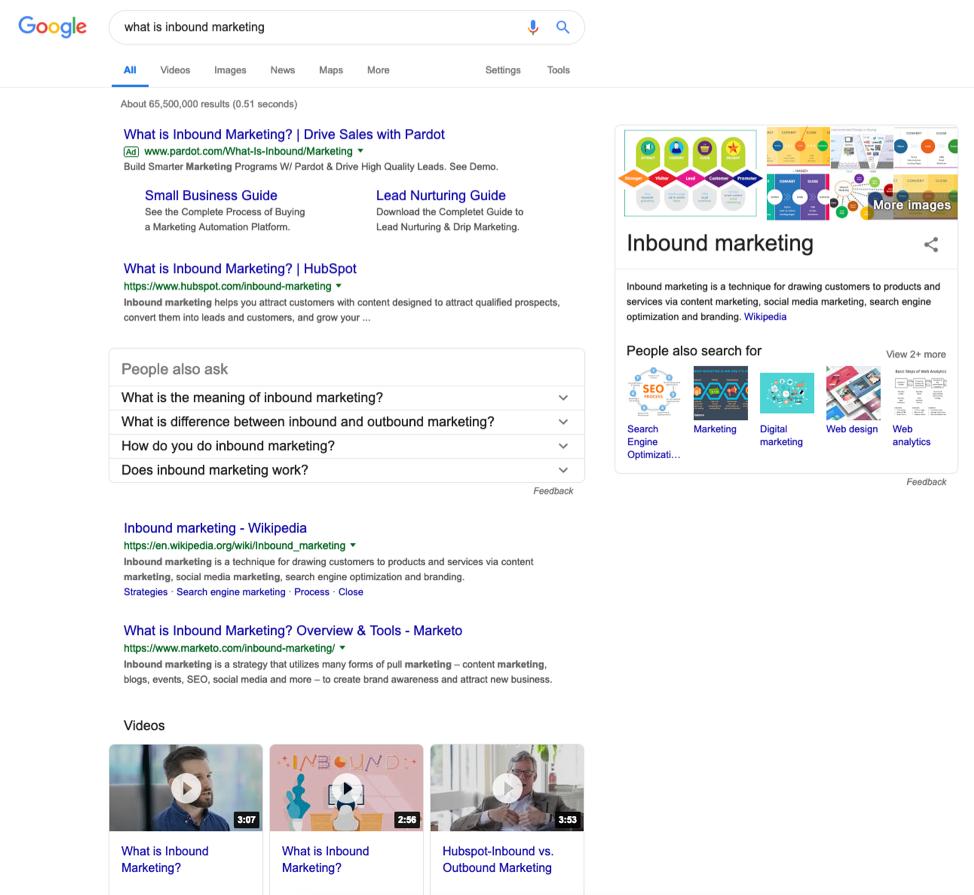
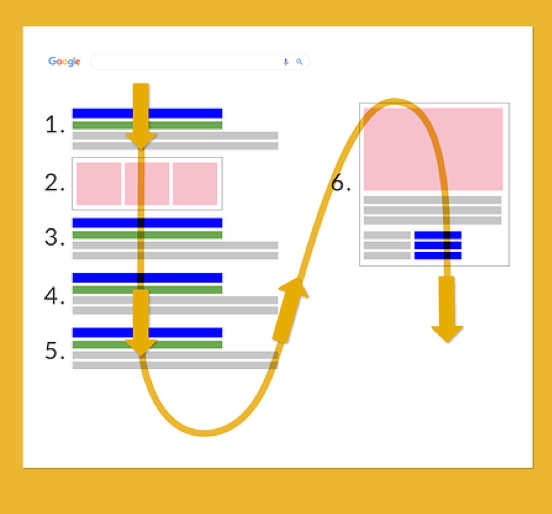
Today more than ever, SEO is about “owning” real estate on Google’s SERPs (Search Engine Result Pages) because of all the SERP Features.
1. Featured Snippets
Featured Snippets are the boxes at the top of Google’s organic results. These are typically a paragraph, list or table.
2. Knowledge Panel
The Knowledge Panel is the data that appears in the panels with information about people, companies and other popular searched queries gathered from a variety of sources.
3. The Local Pack
The Local Pack consists of the three local results under the map for a given query. This is created by a separate local search algorithm.
4. People Also Ask
People Also Ask is a list of questions, and their answers, that other people have asked and that Google believes are relevant to the current search query.
5. Up to 4 Ad Units
Up to 4 Ad Units at the top of the SERPs push organic listings down further and are also an opportunity for more searching of real estate.
Another thing about the SERPs is that they are no longer static. Back in the day, when keyword reports accurately reflected SEO performance, a page would pretty much rank in a certain spot until the next Google search algorithm update.
That was then…
Today, the SERPs are created differently by two HUGE changes in Google’s algorithm.
Rank Brain
Rank Brain is an AI component of Google’s core algorithm. It’s widely believed that Rank Brain uses an interpretation model to determine search intent by using factors such as location, personalization and the words in the query.

BERT
Bidirectional Encoder Representations from Transformers – BERT for short – is Google’s way of better understanding the context of the words in a search query. Search Engine Land describes BERT as “a neural network-based technique for natural language processing pre-training.”
When you look at these two components of Google’s algorithm, you see that Google isn’t only working on personalizing search results; it’s also understanding the context and intent of the search query.
These two elements of the algorithm create so many more opportunities for your website pages and blog posts to show up in the SERPs that keyword ranking no longer accurately measures the performance of an SEO strategy.
Instead of looking at keyword reports, I propose that we start thinking about the total exposure of a site or page of a website in Google’s SERPs as a way of monitoring the performance of an SEO strategy.
TL;DR – Steps for Measuring SEO Performance
Here are 8 steps to measure your SEO strategy:
 Review impressions and clicks for your site.
- Review the Performance Report Google Search Console (GSC).
- Compare last 28 days YoY for most current issues.
 Inspect pages for an increase or decrease in impressions and clicks.
- View new successes with your SEO strategy, review the pages that have had an increased in impressions and clicks.
- Discover potential challenges for your SEO strategy by reviewing the pages that have had a decreased in impressions and clicks.
 Compare the traffic quality of the pages in Google Analytics.
- Check to see if User Behavior metrics and Goals have gone up or down.
- Review Bounce Rate, Pages/Visit, Average Sessions Duration, Goal Conversation Rate and Goal Completions.
 Discover the keywords for which the pages are ranking.
- Review the search queries for pages to find the keyword terms that the page has seen an increase or decrease in impressions and clicks.
- Determine if change is due to a change in average rank.
 Investigate any keywords that have completely dropped out of the SERPs.
- Discover the search queries for which the page no longer has any impressions in the SERPS.
- Determine if the queries are related to the topic of the page
 Create a keyword trending report for the main keywords.
- Use a ranking tool to track targeted keywords
- Use the ranking report as a trending tool to alert you to successes and challenges
 Find SERP Features opportunities.
- Leveraging a rankings tool to find SERP Features to target
- Optimize your page accordingly to gain targeted SERP Features.
 Build an SEO performance dashboard.
- Build a reporting dashboard that reports search exposure changes
- Review the dashboard to find page or sections of your website that need optimizing.
Keyword Ranking Reports No Longer Give Us the Full Picture
Now that Google’s SERPs are dynamic, rankings just don’t do it for us. You can see different rankings on separate computers that are on the same network in the same office.
Search engine exposure takes the dynamic aspect of the SERPs into account, which is why it can help you monitor and measure your SEO strategy.
When your SEO strategy is cranking on all cylinders, the increased organic traffic to your website that you see can be due (in part) to three aspects of SEO:
- Increased rankings
- Ranking for new keyword terms
- More links in the SERPs
That third one is the important one!
Because of the SERP layout and features that I mentioned earlier, your website could have multiple links.
Let’s look at an example:
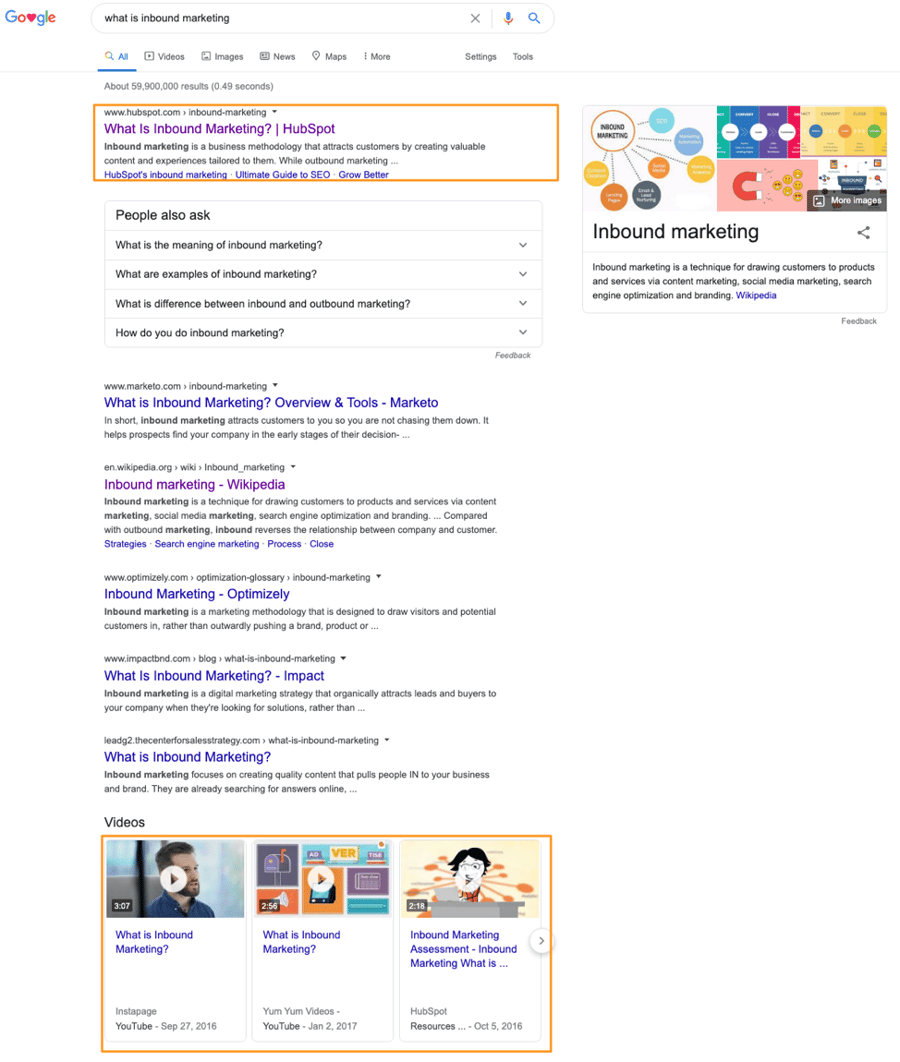
We can see that HubSpot has two links and two impressions on the first page of Google’s SERPs for the keyword phrase what is inbound marketing
- First organic positions
- Video link
A ranking’s report WILL NOT show you this.
Also, if you’re looking at a static keyword report, you aren’t seeing the gains or losses due to new keyword phrases. These keywords can comprise a good part of your organic traffic. If you monitor only the keyword(s) that you’re targeting – and not the keywords that your target audience is using to find you – you stand to lose visitors that you could convert to leads and sales.
Instead of using keyword rankings, I look at impressions, which I call search engine exposure, to monitor my clients’ SEO.
8 Steps to Measure SEO Performance Using Search Engine Exposure
In its simplest form, search engine exposure correlates directly with impressions in Google’s SERPs to alert you to changes in your SEO strategy performance.
-
If impressions increase, search exposure is increasing.
-
If impressions decrease, search exposure is decreasing.
Unfortunately, nothing in the SEO world is that cut and dried; there are multiple reasons why impressions do or don’t correlate with traffic. What you can be sure of is that they do correlate with changes in your SEO strategy
One thing to note is that search engine exposure monitors only the performance of your SEO strategy; it doesn’t tell you what you need to do. To find that out requires a more in-depth review of both the SERPs and your competition.
Here’s how I leverage search engine exposure to manage my clients’ SEO.
Review Impressions and Clicks for Your Site
I love looking at page impressions. I know that some people in the SEO world discount this metric, but I don’t understand how. After all, the more often that you show up in the SERPs, the better the chance that you’ll receive search traffic.
To get an idea of how you’re doing RIGHT NOW, let’s look at the last 28 days:
- Log into Google Search Console (GSC) and navigate to the Performance Report.
- Set the report to compare the last 28 days year-over-year (YoY).
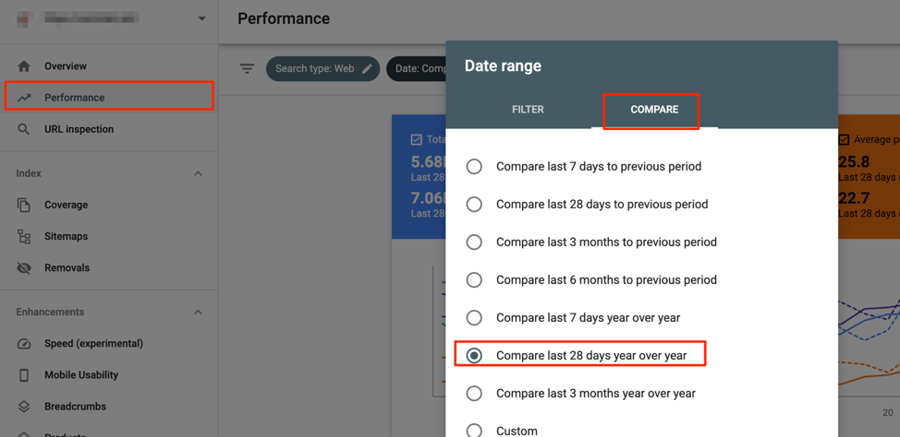
I use YoY because it gives a more apples-to-apples comparison. While you sometimes need to compare previous periods, e.g. to confirm the effects of an algorithm update, you have to consider seasonal trends. For example, January comparisons are vastly different from December ones because of Christmas and New Year. If you’re a retail business, you’re probably super-busy in the December lead-up to Christmas, but B2B businesses usually see decreased traffic at this time.
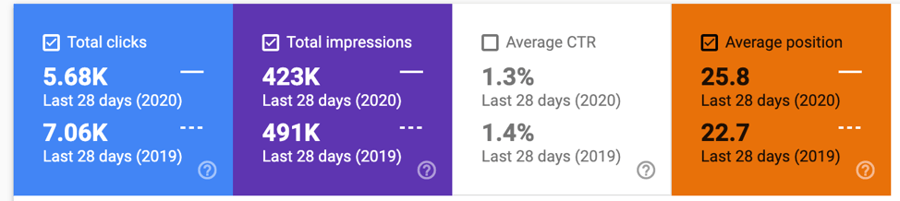
Look at the decrease in impressions and clicks; we need to see why this happened!
If impressions and clicks are increasing, there’s a good chance that your SEO strategy is working. Keep in mind, though, that this is looking at the site as an entirety.
Using the example above, let’s drill down to see which pages are really losing impressions and clicks.
Inspect Pages for an Increase or Decrease in Impressions and Clicks
If you look below the data in the chart and graph on the performance report, you’ll see that you can view the data by:
- Queries – terms people searched that resulted in an impression of a page of your site in Google’s SERPs
- Page – what pages registered impressions in the SERPs
- Countries – the searchers’ locations that resulted in an impression
- Devices – what devices searchers used when performing a search
- Search appearance – what special search results your website is receiving in SERPs (e.g. Rich Results, Product Results, etc.)
- Dates – SERP metrics for specific dates
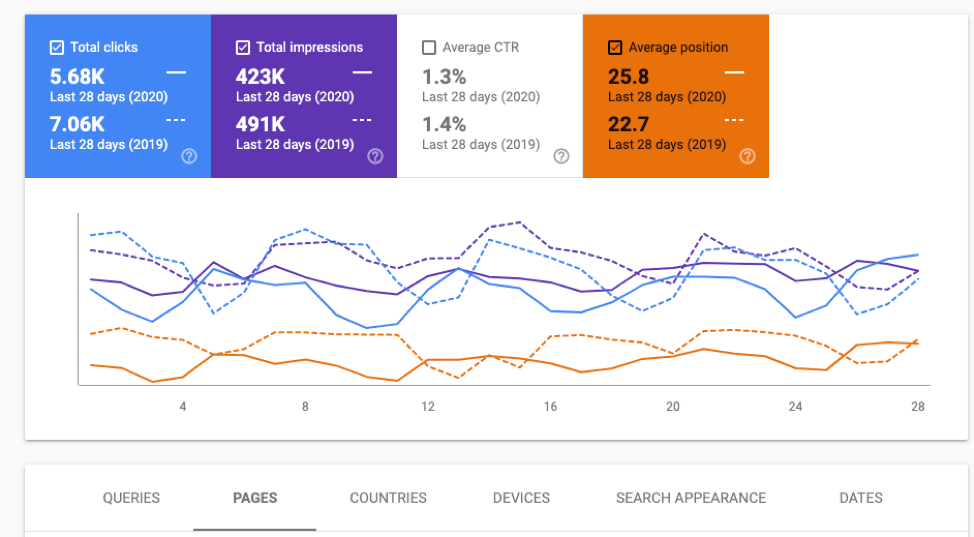
If we select PAGES, we can really get into which pages are doing well and which require some attention…
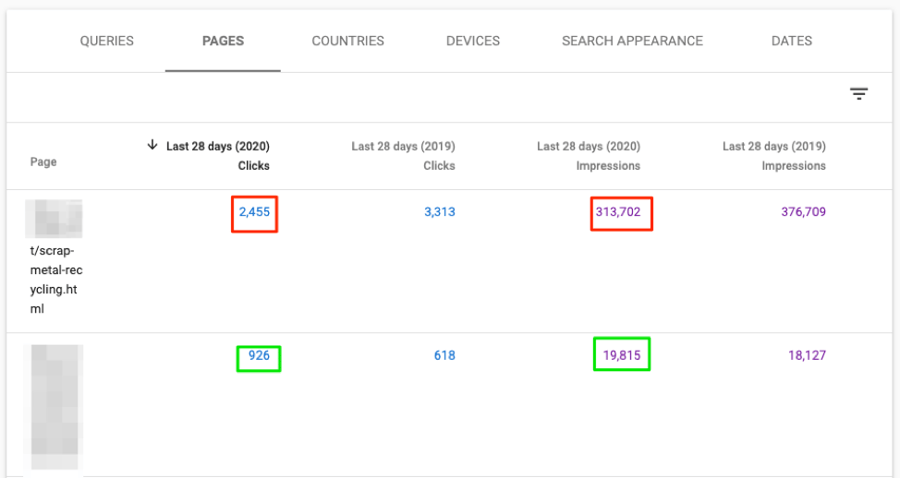
…and then we can see exactly which keywords pages are ranking for.
Compare the Traffic Quality of the Page in Google Analytics
You want people to visit your site, page or post –bottom line – so that they will become a lead, download a file, make a purchase, etc. That’s your goal. Before you take a deep dive into your SEO stats, then, take a look at Google Analytics to see how it’s affecting them.
- If your traffic goes up and user behavior / goal conversion rate significantly decreases, this could be a sign that your page is no longer meeting your visitors’ needs. You could be ranking for some irrelevant terms, or maybe the search intent of the SERP has changed. Update your page to meet the intent and expectations of your visitors.
- If your traffic goes down and your user behavior / goal conversion rate increases, this usually indicates that you’ve lost rankings for irrelevant keywords and that Google is sending you better quality traffic and you’re meeting or exceeding your visitors’ search intent and expectations. That said, you’re better off confirming that the keywords now sending less traffic aren’t as relevant as the ones sending the bulk of the traffic.
- If your traffic, user behavior and goal conversion rate increase, give yourself a pat on the back! Everything is working as you expect. Review your ranking trends or check GSC to see what keywords are responsible for the uptick in traffic.
- If traffic, user behavior and goal conversion rate all decrease, something has changed with your rankings. Diagnose what the issue is with your SEO strategy.
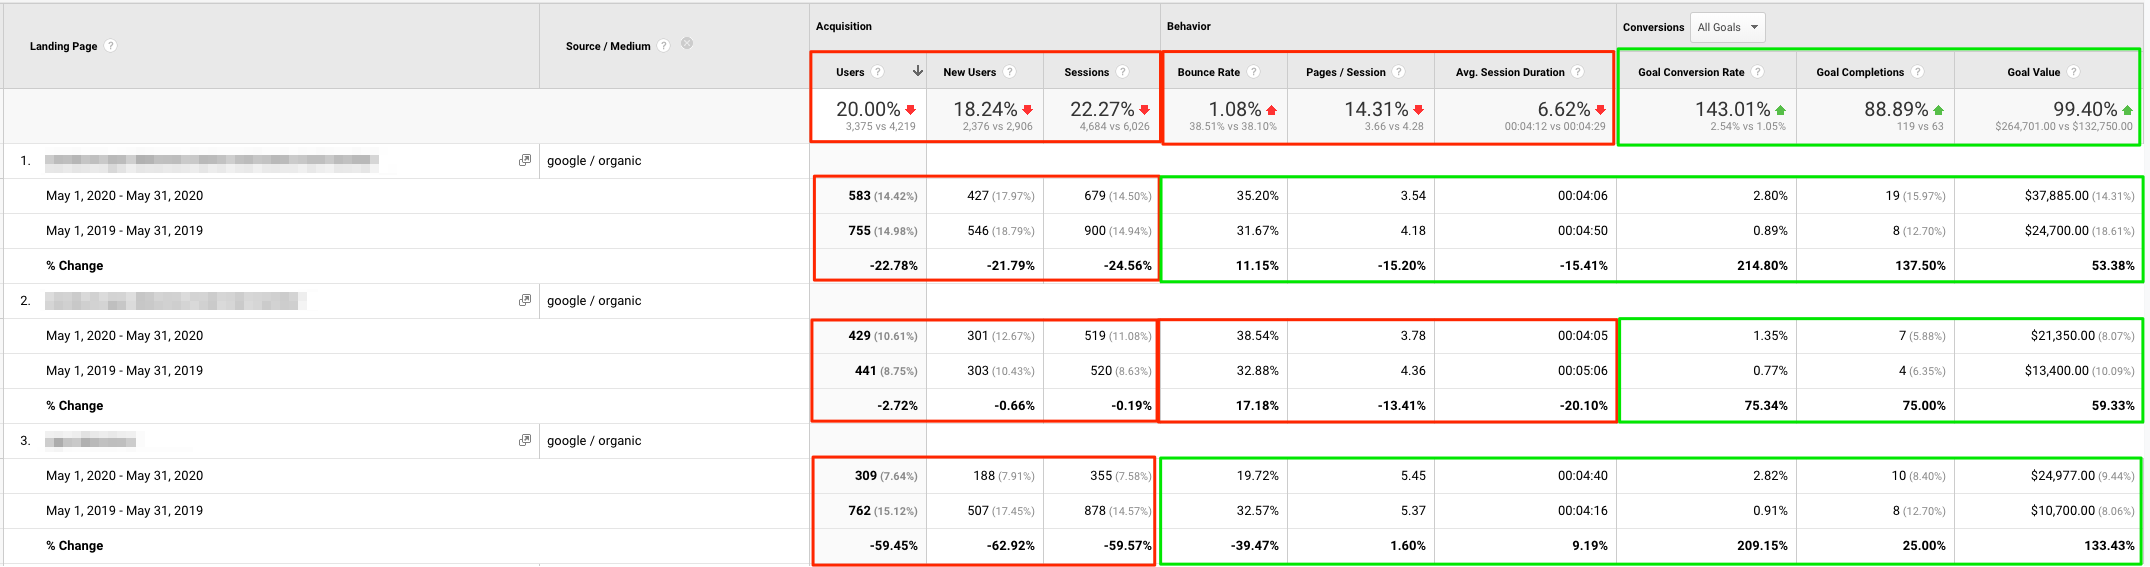
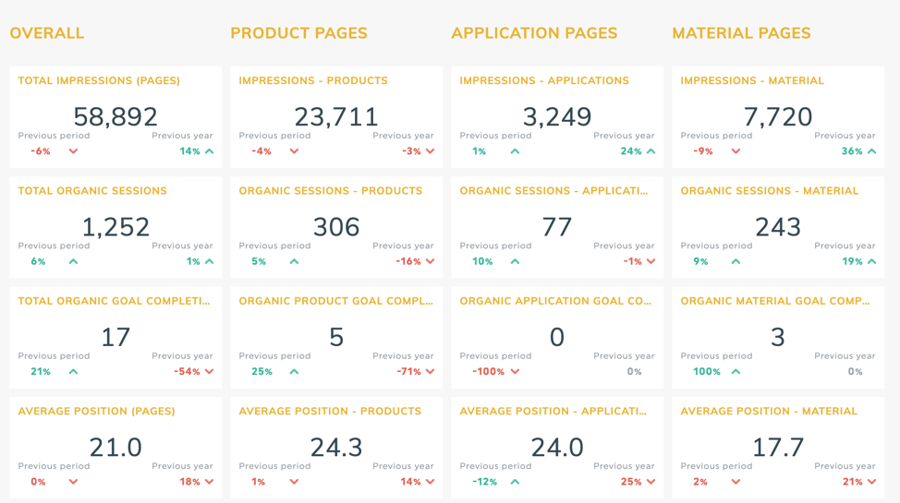
Overall, Acquisition and Behavior metrics are down for this content strategy while Conversion metrics are up. Looking at the Top 3 pages, each saw a decrease in Acquisition, but saw increases in Conversions. Two of three also saw an increase in Behavior.
Discover the Keywords for Which the Page Is Ranking
To look at any single page in the report and the keywords for which it has shown in the SERP, all you have to do is click on it and make sure you are in the Queries view.
Let’s look at that the scrap metal recycling post that lost 63K impressions and almost 1K clicks.
First off, I’m not surprised that this post lost rankings: it’s 3 years old and we only did 3 months of outreach after it was published.
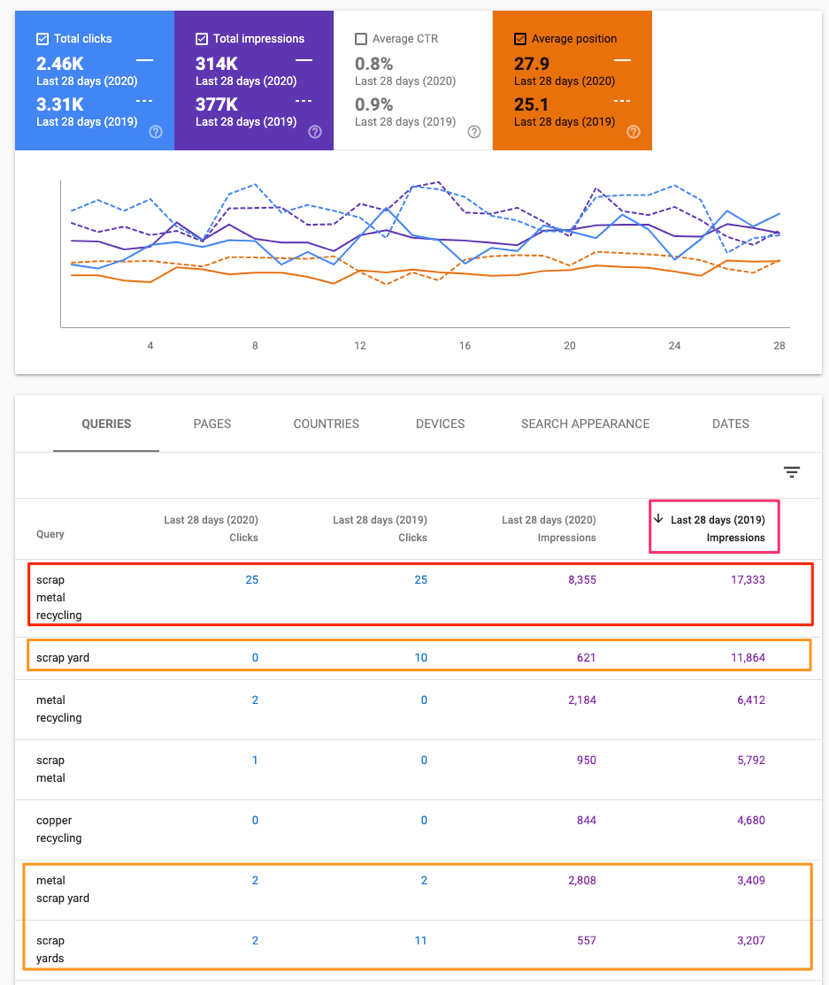
What you see here is that it lost exposure with the main targeted keyword scrap metal recycling. It lost exposure on irrelevant terms that include scrap yard, too, but I’m not too concerned about that.
So, let’s check out the terms that lost clicks. One thing to note about query clicks is that Google doesn’t provide you with every click on that term. For privacy reasons, Google provides only the clicks of users not logged into a Google Account, meaning that query clicks are no more than a guide or trend.
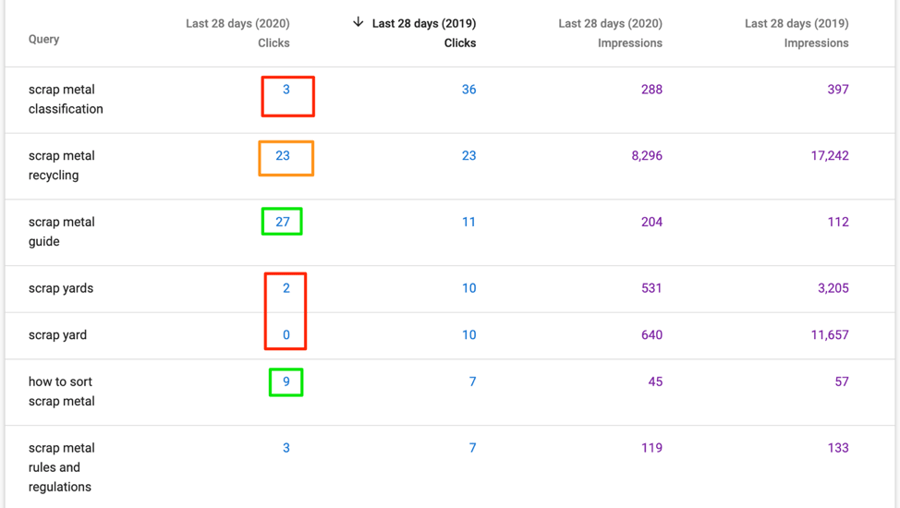
As you see, according to GSC, the site didn’t lose many clicks for scrap metal recycling even though impressions decreased by 9K. But impressions and clicks went up for scrap metal guide, which is actually more relevant to the post than the original targeted keyword phrase.
What’s really interesting is that it didn’t lose much average position YOY
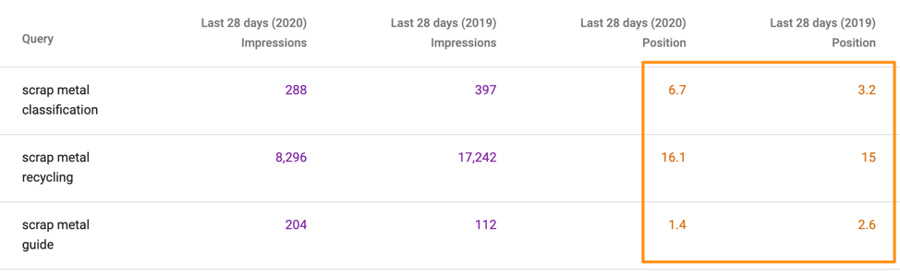
What this shows is why we can’t rely on position or rank too much. In this case, it’s an average. And a year ago, the SERPs looked different from the way they look today – particularly with Google no longer showing a duplicate listing when you have the feature snippets.
Investigate Any Keywords that Have Completely Dropped Out of the SERPs
The first thing I want say about this is that it isn’t always a bad thing to lose rankings. If the keyword was irrelevant to the page’s topic, the quality of that traffic was probably rather poor and wasn’t converting to leads or sales.
On the other hand, if the keyword phrase is relevant, you need to figure out why you lost rankings and what you can do to regain them – or even increase them.
To do this, you can filter to see only the queries that have had 0 impressions in the last 28 days.
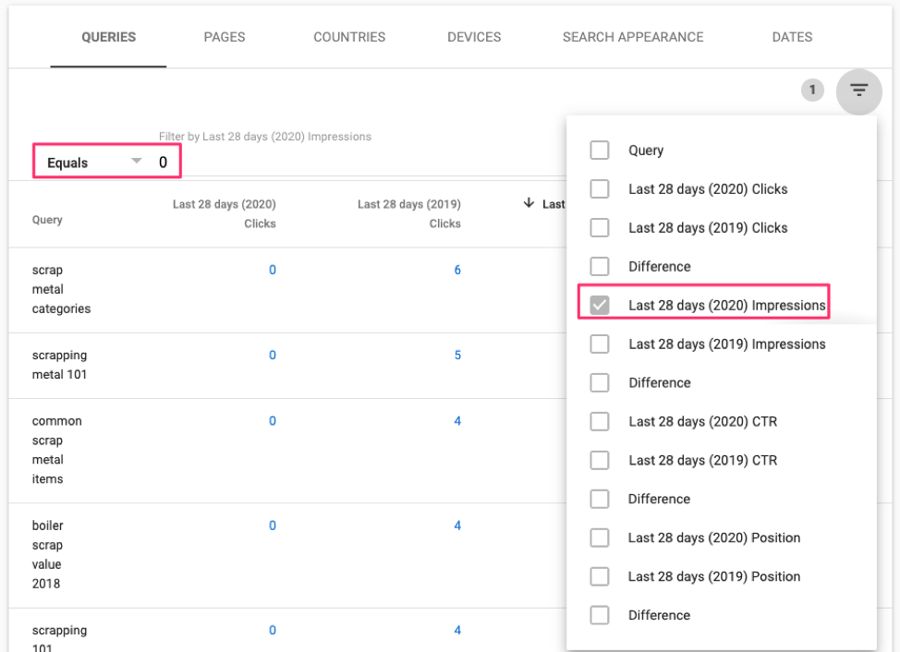
With this filter in place, we can see that the site lost a bunch of exposure for irrelevant terms:
- Scrap metal categories – the post mentions ferrous and nonferrous but doesn’t explain clearly what these terms mean.
- Common scrap items – the post says nothing about this topic.
- Boiler scrap value 2018 – this is dated by 2 years and the word “boilers” shows up only once.
But the site also lost exposure for some low-search-volume keywords that would still be nice to have:
- Scrapping metal 101
- Scrapping 101
Create a Keyword Trending Report for the Main Keywords
Now that you know what keywords are doing well and which ones are your new targets, you can create a keyword report to trend performance for those specific keyword terms.
While I don’t see rankings as a KPI, knowing where your target keywords are ranking, along with their search volume, can help you monitor the SEO strategy for your pages.
There are plenty of tools that you can use for this, including SEMRush.
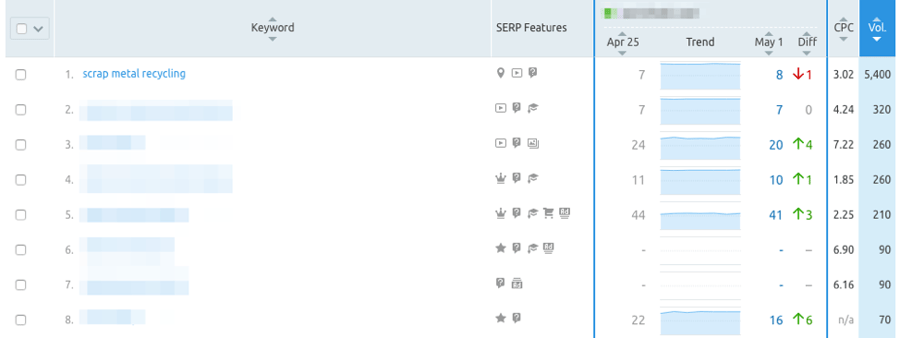
Like I said, I don’t think of rankings as a KPI, but this is a nice report to show a snapshot of the strategy. A better KPI would be organic search volume with a SMART Goal of increasing Google Organic Search Traffic by 20% over the next 6 months. You might target a specific keyword in your plan, but you should also gain exposure with other keywords that will also help you reach your goal.
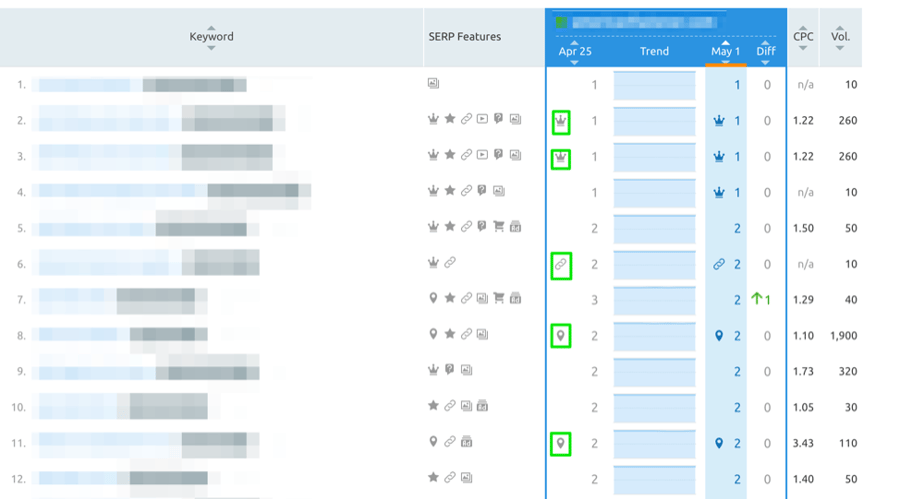
Find SERP Features Opportunities
Tracking and optimizing SERP Features is another key tactic for SEO. GSC’s impressions take into account all the SERP Features in which your page or post appears, such as featured snippets, site links, videos, people also ask, images, etc.
You can add tactics to your SEO arsenal to try to receive these features, and you can track your success with a tool such as SEMRush.
Build an SEO Performance Dashboard
When I monitor a client’s search engine exposure, I like to include it in a reporting dashboard. Typically, I’ll find a group of pages that are part of the same content strategy to use, to easily review SEO performance.
Here at PIC, we use DashThis for our monthly reporting dashboards, and I include a search engine exposure report that provides a monthly snapshot of the SEO strategy. This allows the client to see how previous optimizations are working and where attention is needed.
Why Can’t We Look at Rank Alone?
Let’s be clear: I don’t ignore ranks. After all, the ultimate goal for any SEO strategy is to rank #1 for its targeted keyword phrase and as many medium- to longtail keywords as possible.
If you use a ranking tracking tool, you’re looking at a snapshot of one search, from one computer.
Now that the SERPs are dynamic and personalized, keyword ranks don’t mean as much. Also, when you look at GSC metrics, you’re seeing an average rank:
- For the set time period
- That can be affected by personalization (location, search history, etc.)
- And that includes all search result elements (traditional listings, carousels, featured snippets, Knowledge Graph cards, etc.).
That said, the site that ranks first typically receives the most clicks. This is why it’s still very important to strive for an average #1 ranking.
And it’s your SEO tactics that will help you achieve this most precious rank. But to see if your tactics are working, it’s your organic traffic to your pages that you need to focus on.
When your SEO strategy is cruising in top gear, you’re picking up more and more longtail keywords and showing up for terms that no one’s ever searched before. Most of the time, the new keywords you gain aren’t on the first Google page – they’re on page 3, page 5, page 8.
These new keywords are a great sign that your SEO strategy is working, but these rankings still aren’t ideal, so don’t be surprised if your rank suffers.
For my money, total impressions is by far the best metric when measuring your SEO and content strategies.
Why Impressions over Rank?
Why are total impressions more valuable to you than rank?
Well, if your site or page is going to get organic traffic, it must be seen in the SERPs. Impressions tell you exactly that!
What Is an Impression?
I have to admit one thing here:
Understanding how impressions metrics are calculated in GSC can be a little confusing. Here’s how it’s explained in Search Engine Land’s article Demystifying Google’s Guide to Clicks, Impressions and Position in Google Search Console:
Impressions. For standard organic listings (10 blue links), an impression is recorded even when it hasn’t been scrolled into view. So, in the 10 blue links, if your listing is #9 and below the fold, it still counts as an impression if the search result page was loaded. This confuses some people based on how Google treats carousels (more on that soon.) Also, a link must receive an impression for its position to be recorded. That sounds obvious, but worth noting.
Monitoring SEO is all about trends – specifically, finding the right ones. Google still provides the best information about your site’s performance in its search engine.
And impressions provide a better sense of what’s going on than keyword clicks or position metrics in GSC.
 Keywords Rankings on SERPs
Rankings and keywords are still important.
Between new features, feature updates, and algorithm changes, Google’s SERPs are evolving more often than ever before.
Think about this…
On any given day, Google might update its algorithm multiple times. Most of the 500–600 updates made every year are minor updates that go unnoticed.
But, several times a year, Google rolls out a major update to the core algorithm that can affect your rankings and organic traffic numbers.
This is why tracking keywords is still important when evaluating an SEO strategy. Keep in mind, though, that a change in rankings is only an alarm indicating that something is either working or not.
This is because we’re not just dealing with major updates now; we’re including Rank Brain, BERT, SERP layout, SERP Features, etc.
 How Can You Improve Your SEO?
Search engine exposure gives you that top-level view of your SEO strategy. Using GSC, along with some other tools, you can take your SEO to the next level by taking a bigger dive into the data – which can prove a treasure trove when it comes to improving your SEO and overall content strategy.
- Further optimize your on-page SEO using relevant keywords in the content, headlines and/or meta title.
- Support a page’s SEO effort and increase relevant traffic by creating new pages/blog posts around relevant secondary keywords for which the page is ranking.
- If you lose ranking for some secondary keywords that are relevant, create new pages and blog posts around those keywords to build back those lost rankings.
- Use a tool like SEMRush to monitor search result elements and optimize accordingly.

Paid Search Exposure
I love paid search advertising and recommend it for almost every client.
Here’s the thing about paid search…
It increases your exposure with the flip of a switch.
And when you’re ranking on the first page, your ad will be increasing the real estate that your company has on page 1 and improving the chances of you getting a click to your website.
That said, your on-page SEO efforts can also improve your paid search traffic and conversions.
This is because Google Ads uses a metric called Quality Score to measure how relevant your ads and landing pages are to your targeted keywords.
A side effect of improving your on-page SEO is therefore that you might also increase your Quality Score. Typically, when you improve your Quality Score, your ads will be better positioned and you’ll pay less per click.
Final Points on Measuring SEO Performance
Clearly, traditional keyword ranking reports no longer hold the same value. This is where search engine exposure comes in, for measuring SEO performance and getting alerted to SEO changes.
Key Takeaways
- With so many search results feature available for your website and its pages in the SERPs, traditional keyword reports are no longer sufficient for measuring SEO performance.
- Today’s dynamic SERPs require you to look at your entire search engine exposure for a top-level overview of your SEO strategy.
- Impressions give you a better understanding of your SEO performance than rank.
- Monitoring your search engine exposure will reveal opportunities to improve both your pages and your content strategy.
Tools to Help Monitor and Measure SEO Performance
There are many tools that you can use to help you measure and monitor SEO performance, here are the ones that are mentioned in this post and we use.
- Google Search Console is where you will find the pages and search query that have changes in impression and clicks
- Google Analytics is where you will analyze the quality of the traffic that visiting your site from Google.
- SEMRush is a search engine marketing software where we set up ranking reports.
- Dashthis is the Dashboard software where you can create reporting dashboards to monitor your SEO performance.